ABOUT
The Laboratory Services Committee of the American Thyroid Association® (ATA) conducted a survey of ATA® members to identify areas of member interest for education in pathology and laboratory medicine. In response to the results of the survey, the Lab Service Committee developed a series of educational materials to share with the ATA® membership. The topics below were ranked as high educational priorities amongst the membership.
ACCURACY AND PRECISION
WHAT ARE THE INDICATORS OF TEST RELIABILITY?
The most commonly used descriptors of analytical performance for laboratories are accuracy and precision. Accuracy is the degree to which the test results approximate the value that would be obtained by a reference method, and precision is the reproducibility of test results among measurements, days, and operating conditions. The metrics of analytical performance are distinct from the metrics of clinical performance, which are focused on sensitivity, specificity, and predictive values.
ACCURACY (TRUENESS)
A test method is said to be accurate when the values it produces are close to the values that are obtained from a reference method. Thus, the concept of accuracy is highly dependent on the correct choice of a reference method as all judgments of accuracy treat the reference method as truth; deviations from the reference method are therefore inaccuracies or bias. The fine details of choosing a reference method are beyond the scope of this text. In short, the choice of a reference method is often a compromise between which method is historically accepted, which method is readily available from a reference lab, and which method can perform under other pertinent constraints such as specimen requirements and cost.
In chemical analysis, accuracy is a test’s ability to measure the true amount or concentration of a substance in a sample. In a bull’s-eye diagram – the center of the target being the “truth” or the value obtained by a trusted reference method – the accuracy of a test dart is analogous to how close the dart hits the target (Figure 1A). If multiple darts are thrown, and their average distance from the center is taken, an accurate dart thrower will average on the center.
Thus it is possible for an aggregate of results to be perfectly accurate even if single results are inaccurate.
PRECISION (REPEATABILITY)
The description of accuracy above demonstrates why this metric alone is insufficient to characterize how a test performs. Three arrows shown in (Figure 1B) are all very inaccurate, but they average to be accurate. Precision is the metric that demonstrates how much single results can vary from the average result. Thus, in common parlance, “precision” really means “imprecision,” for it describes variance on the mean of replicate measurements; the higher the variance the more imprecise a measurement is. Since precision requires replicate measurements, the precision of a single value cannot be known. This is intuitive when considering the bull’s eye analogy because a single arrow hitting the target may be chance or skill – the only way to know the difference is to have the thrower attempt multiple throws. A precise dart thrower will throw darts perfectly in the same spot repeatedly. If they are close to the bull’s eye, then the results are accurate and precise. If they are far from the target, then the results are said to be inaccurate and precise (Figure 1C).

TERMINOLOGY OF ACCURACY AND PRECISION
Routine laboratory analysis of accuracy and precision relies on statistical metrics and plots. The simplest statistic for accuracy is the bias: the test value minus the reference value divided by the test value. The simplest statistic for precision is the standard deviation. Usually the standard deviation is expressed as a percent of the mean or a “coefficient of variation” or CV. Thus, if a number of replicates are taken for a specimen that has a reference value of 1, and the test method gives an average of 1.01 with a standard deviation of 0.05, then the test is said to be accurate to within 1% with a CV of 5%. Since methods are ideally suited to specific measurement ranges, it is also useful to look at a test in terms of its accuracy and precision over the range of values that will be encountered clinically. If the average of values is different from the reference method in a constant manner, then the method is said to be constantly biased. If the accuracy of an assay worsens as the concentration of the analyte increases, then the method is said to be proportionally biased.
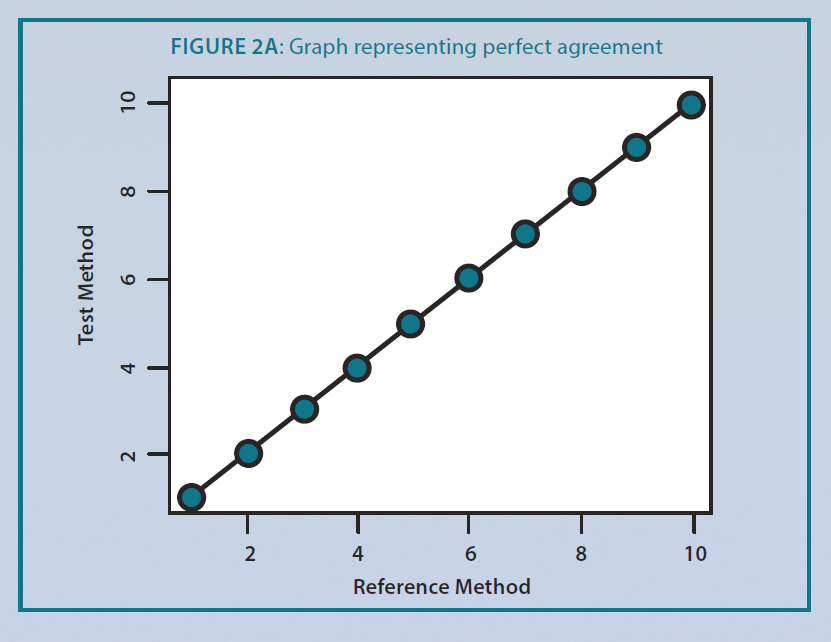
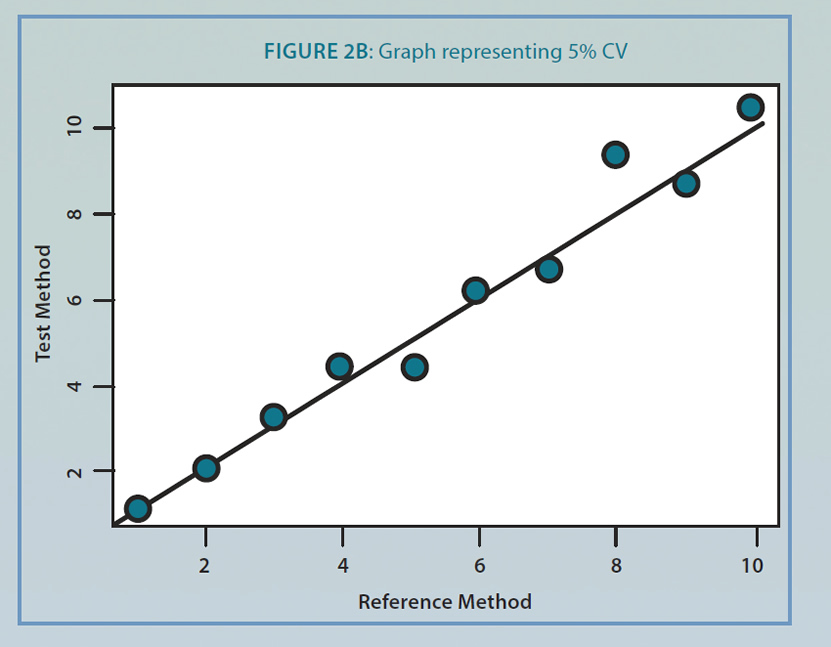
The simplest plot to visualize precision and accuracy is a graph of reference method results (x-axis) versus test method results (y-axis). All other things being comparable, a perfect agreement between the reference and test methods would show a line with a slope of one and an intercept of zero as in figure 2A. With a 5% CV, the slope of the reference versus test values changes. In figure 2B, the intercept of the line is 0.07, and the slope of the line is 0.97 indicating a constant bias of 0.07 and a proportional bias of 0.97. Whether these metrics are acceptable for clinical use is a matter of clinical judgment of the laboratory director and takes into account assay performance at key ‘decision points’ along the measureable range in the assay.
PRECISION
HOW RELIABLE IS LABORATORY TESTING?
The accuracy and precision of each test method are established and are constantly monitored by professional laboratory personnel. Sensitivity and specificity data are determined by research studies and are generally found in medical literature. In designing test requirements, the key consideration is not perfection but rather “fit for purpose” – the question of whether a test has the precision and accuracy to function for the clinical purpose it is intended. The concept of “fit for purpose” is simple prima facie but complex in practice, for tradeoffs exist between sensitivity and specificity, accuracy and precision, and between a variety of logistical considerations. Therefore, a test needs to be designed from the beginning with its use and practical constraints in mind.
A laboratory should investigate the accuracy and precision of a method when the method is new, the method is questioned because of external quality control data, or the validity of the results is questionable. It is standard practice to check the accuracy and precision of laboratory equipment whenever a new instrument is brought into the lab, when equipment is suspected of being damaged and on a periodic schedule thereafter.
VARIABLES THAT CAN AFFECT LABORATORY TESTING:
There are several factors that can affect the accuracy and precision of a test such as the stability of the analyte where some substances are stable at a certain temperature and others are very unstable at room temperature. The stability of the specimen during transport from the patient to the laboratory should be monitored. Inter-laboratory variations can also affect accuracy of a test because different laboratories use different reagents and instrumentation for performing the same test.
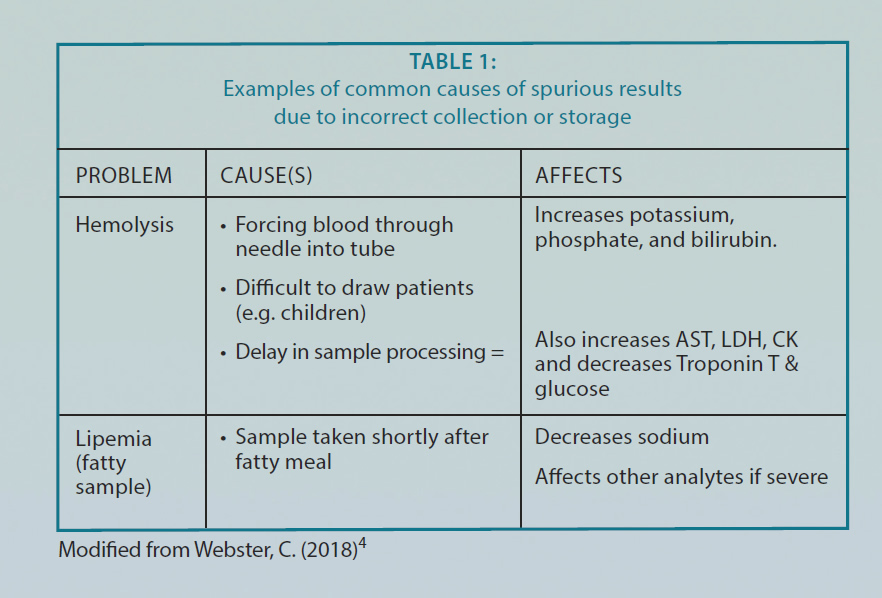
There are some preanalytical variables that can be controlled such as time of collection (for analytes with diurnal variation) and fasting (such as for glucose). Other conditions might interfere with the analysis of the test assay (analytical variables) such as hemolysis, hyperbilirubinemia, hyperlipidemia, and hyperproteinemia, etc. (see examples in Table 1). Some drugs, autoantibodies, heterophile antibodies, and interferences directed against assay reagents could also affect the accuracy of laboratory tests. Interferences are usually analyte- and assay-specific and may go unrecognized in routine laboratory practice1. It is the effect of another substance present in the sample that alters the assay conditions and affects the output of the measurement procedure1. Various sources of interferences have been identified mainly for immunoassays such as autoantibodies, heterophile antibodies, and interferences directed against assay reagents (e.g. biotin interference in assays that utilize streptavidinbiotin interactions for assay antibody anchoring or capture).
Heterophile antibodies are natural antibodies that react with immunoglobulins (Ig) from two or more animal species.1 They are characterized by polyreactivity, low affinity, and weak binding; and they may occur in up to 40% of the population.1 The origin of heterophile antibodies is usually unclear, but they can be associated with occupational exposure and contact with animals, or the consumption of certain food products.1 These antibodies are well-known sources of interference in two-site (immunometric or sandwich type) immunoassays, where they can react with one or both of the (monoclonal or polyclonal) antibodies used for the capture and detection of the analyte, most often resulting in falsely elevated results.1 It is important to block this type of interference by careful assay design, that is, using mechanisms that block these antibodies in the patients’ samples. If heterophilic antibodies are suspected the laboratory should be contacted for appropriate troubleshooting.
Biotin is an over the counter vitamin supplement that is marketed to improve hair growth and nail development.2 If patients are taking high dose of the vitamin, this can affect test accuracy. Typically, biotin has a very short half-life (less than two hours) and usually takes four to five half-lives (8 – 12 hours) to eliminate the biotin interference. Although the recommended dosage is 30 μg per day under expert guidelines for daily supplements; some over the counter supplements advertised for healthy hair, nails and skin might have as much as 10,000 μg which is more than 300 times the recommended dose.2 Therefore clinicians should investigate the intake of biotin in their patients if they get anomalous results that are inconsistent with the patient’s presentation. Patients should be advised not to take large doses of biotin for one to two days before a sample is collected. There are at least two types of common assays that use the biotin-streptavidin formulation: competitive assays and sandwich assays. Competitive assays are typically used for low-molecular weight targets such as thyroid hormone (T4); these can give falsely high results if excessive biotin concentrations contaminate the sample. Sandwich assays are used for bigger molecules such as TSH; BIOTIN can cause falsely low readings.2
Excess biotin intake has been associated with factitious diagnosis of Graves’ disease due to biotin immunoassay interference despite no evidence of clinical symptoms.3 The patient’s thyroid function tests were normalized once the patient’s biotin ingestion was stopped. Table 1: Examples of common causes of spurious results due to incorrect collection or storage.
REFERENCES
- Lakos G. Interference in antiphospholipid antibody assays. Semin Thromb Hemost. 2012;38(4):353-9.
- Paxton A. Beauty fad’s ugly downside: test interference (September 2016). CAP today
- Elston MS, Sehgal S, Du Toit S, Yarndley T, Conaglen JV. Factitious Graves’ Disease Due to Biotin Immunoassay Interference-A Case and Review of the Literature. J Clin Endocrinol Metab. 2016;101(9):3251-5.
- Webster C (January 31, 2018). Retrieved from https://www.heftpathology.com/ Blood-Sciences/key-factors.html
FURTHER INFORMATION
For more information on the survey findings, see Thyroid, Vol. 27, No. 12. https://www.thyroid.org/professionals/ata-publications/